Note: The HeartTuner is now available - -updated- Mar 07: see goldenmean.info/hearttunerspecial
Feb, 2002.. Edited and assembled by Dan Winter, with acknowledgements to Jan and Marc and many who have supported this project.



|
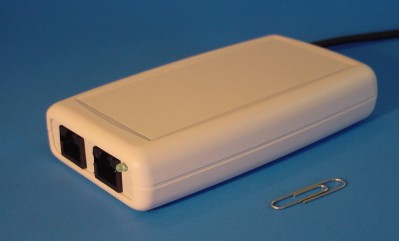
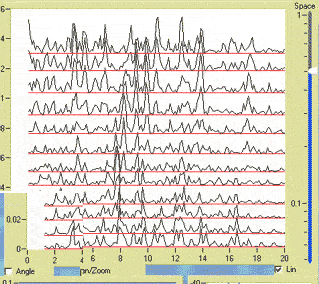
The HeartTuner is a revolutionary device for biofeedback. The underlying philosophy is a sound scientific and philosophical analysis of how waves organise and create life and consciousness. The HeartTuner device measures the waves in the body and analyses their content. This analysis is clearly displayed in several graphical plots suited for biofeedback. Beside the raw signal, a spectrum analysis and a so called septrum analysis, that is a second order Fourier analysis and heartrate variability is displayed. The precalculated data also becomes available for specifically designed biofeedback games and can be shared over the internet. The hardware part of the device consists of a small white box with the size of a cassette tape with a molded one meter connection cord with a 9-pin female serial connector, two EKG wires with electrodes, two sets of wristbands, white and blue and two head bands in the same colours, a CD-ROM on which is the software and necessary drivers and a printable manual. Optionally one can get a serial-to-USB cord for connection to a USB port, a 'biological capacititor' probe for lifeforce measurements. The device is shipped in a convenient plastic box. The software includes a data monitor which shows the plain data and the mathematically derived data in clear scalable graphical plots. The program has the ability to save and retrieve measured data. A simple game environment has been created to display the biofeedback data more provocative. This program runs on top of the monitor program. Soon to be released is a utility to share the biofeedback data over the internet with many other people connected to a HeartTuner in order to make collective biofeedback experience possible. Updates of the software will be available on the internet website. For developers there is a special software development kit available that can be used to develop games and creative representations of the data. The manual contains all the necessary instructions for setting up and using the hardware and the basic software. Additionally these is a database of biofeedback related articles for sale. A helpdesk is available to handle customer support and report software requests/needs. The HeartTuner group will provide training and education on the effective use of the HeartTuner. A website will be set up in order to promote the HeartTuner and give customers access to the additional services. The website will also host a HeartTuner server for distributing HeartTuner biofeedback data and communications among groups of users on-line. A database of customers will be created as well as a database of people interested in the product and therapy. Therapists can be able to receive additional training in how to use the HeartTuner in their field of work. A database of therapists using the |
The HeartTuner is a simple biofeedback device which shows you the musical harmonics contained in your heartbeat, "real"-time.
The HeartTuner uses a new mathematical technique which I pioneered, (called "septrum"- a 2nd order Fast Fourier Transform). The amazing ability of this dynamic feedback tool, uses one simple wave peak constantly changing in response to your heart's harmonics, to reveal:
1. The anount of COHERENCE in your heart. Coherence is the difference between your heart as a flashlight, versus your heart becoming a LASER Laser light penetrates far because the waves are aligned in order like soldiers in a column. In order for your heart's electrical energy to penetrate and be sustained, it's important that you too learn coherence. Emotional coherence and electrical coherence are the same thing. With this coherence teaching tool, even young people learn how to"Turn on Your HeartLights" , and the REAL meaning of "Come on Baby-Light My FIRE!
This simple peak's height or amplitude measuring coherence, changing from moment to moment is agreed by most users of HeartTuner to be a 'lie detector' speaking the ultimate truth of your heart.
* For example, it appears to be an accurate way to replace the subjective kinesiology or muscle test. A teacher of kinesiology tested this recently, and found merely imaging himself in each room in his house, his heart would tell him instantly where he could be happy, and where not.
* We regularly use HeartTuner in classrooms of young people, who invariably leave class known EXACTLY what it is to let their Heart Sing. Seeing Heartlink COHENCE soar when you look at someone you love, is a life changing experience - to know HOW to follow your bliss.
* Or take the example of a youg parapelegic boy - no movement control anywhere in his body but eyeballs. When his teacher whispered questions in his ear, and watched his heart coherence UP = YES, DOWN = NO - the teacher had his first conversation ever with the boy. It was a VERY moving experience to see the heart reaching thru all barriers by simply singing. See J.R.'s story. In summary - the first thing the HeartTuner teaches is Heart Coherence (Learn to increase the Peak). It is virtually unquestionable that this is the most powerful tool for teaching EMOTIONAL coherence ever developed.
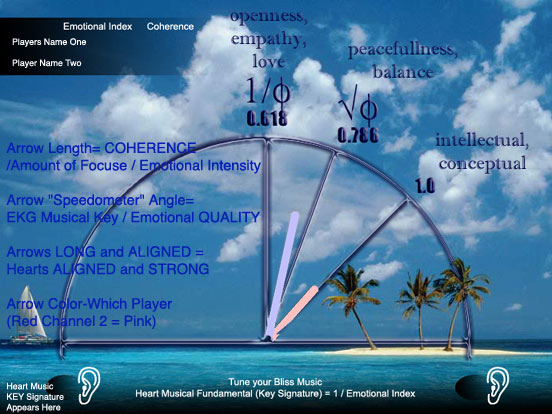
Below: a chart showing an interpretation of the emotional QUALITY associated with various values of the EI number (Emotion Index is the numeric value of the 2nd order FFT peak - it is the inverse of the musical key signature & distance between peaks of the first FFT). While this is very SUBJECTIVE, it has been the result of a large number of users reports. It is important NOT to think of the intellectual more cubic 1.0 EI value as BAD versus the .62 Golden Ratio multiple as GOOD. This is far too simplistic. What is important is to have the FLEXIBILITY to move back and forth. This is what is called Heart Rate Variability We suggest you may want to learn more about. Essentially, extensive Heart Rate Variability literature shows that the more DIFFERENT harmonics (or variable) which are included in your heart's music the healthier you tend to be. This concept that Heart harmonics should be inclusive or fractal is pictured and discusses in the article about health and HRV by Dr. Irving Dardik.
In simple terms, understanding why more CONCEPTUAL emotions are associated with EKG music in cubic harmonics (EI=1.0) is easy. Cubic wave nests make isolating compartments, which are useful if you need more boundaries and structure. Whereas heart music in PHI or Golden Ratio nesting make bridges between boundaries, as all life proteins are five sided to be connective (phylotaxis etc.). This is similar to why cubic architecture makes emotional containment, while five sided architecture makes emotions distribute or share their energy. To stay permanently in either place heart wise, may be undesireable - the goal simply seems to be to learn to flex and choose - by relaxing and intending.
2. Have you ever wondered how get on "the same wavelength" as another person? It turns out now we can measure this. It literally teaches people how to get their hearts' in the right musical "KEY". This is the "key" to empathy and compassion, as well as emotional "range of motion" / flexibility.
The second thing the HeartTuner teaches is THE MUSCAL KEY SIGNATURE or HARMONIC "FUNDAMENTAL" of the heart. The POSITION of the same first peak of the 2nd order FFT (Septrum) -whose height or amplitude taught us coherence, corresponds to the (inverse of) the musical key in which your heart is singing at that moment.
* This enables us to: learn emotional flexibility (which is called Heart Rate Variability - the more harmonics included the more most chronic diseases disappear - Irving Dardik article).
* Also by connecting 2 people at once, (which HeartTuner is designed to do), we can see immediately when 2 people's hearts have 'entrained' or 'phase locked' or 'gotten on the same wavelength'. When 2 persons do "HeartTune" to link up, powerful things invariably become possible. Sensitive and empathic people can always FEEL this which we can now measure. This is probably the most powerful tool to teach CLINICAL EMPATHY, and MARRIAGE COUNSELING, and TANTRA, ever developed.
* Also, thousands of users confirm that when the this Musical Fundamental moves from 1.0 (E.I. - Emotional Index), toward .62 (Golden Ratio), they have acheived moving from HEAD CENTERED emotion, to HEART CENTERED emoting. This is almost unquestionable the first tool ever to make this Heart Centering measureable - and teacheable! Please NOTE however, it is strongly suggested that users feel disappointed if they cannot reach a particular harmonic on the EKG music EI scale.
Remember this number, corresponding (inversely)
to the musical fundamental of the heart is linked to HEART RATE.
The issue which the medical literature has shown (Heart Rate Variability),
is NOT to be able to get to a particular harmonic - but rather
to learn the FLEXIBILITY to have motion to move up and down the
scale. As this becomes more conscious, with feedback helping,
it is true that you develop more harmonic inclusiveness in your
hearts harmonics which is CLEARLY statistically linked to improving
health in general.


Configuration notes:
HeartTuner software is compatible with Windows98, WindowsNT and Windows2000 and Windows XP. We are recommending that you install the software on a computer with a speed of 233MHz or higher to handle the complex spectral display calculations in our advanced new software. Please contact us if you have any questions.
If the troubleshooting tips didn't help, please contact us at: Telephone (Netherlands) 0031 (0) --------
or Email Technical Support: techsupport@.........
USB Support: (Current HeartTuners come with Serial (Com) port plug with USB adapter Optional)
Our new hardware includes Universal Serial Bus (USB) support with an optional USB adapter for simple Plug-and-Play installation. All HeartTuner instruments now support USB (Universal Serial Bus). This development is critically important since many new computers no longer support the COMM port. USB provides a much faster interface, and our advanced Windows software's use of USB should greatly reduce installation problems. We designed our USB adaptor to work with standard Windows drivers for maximum compatibility. Depending upon your hardware and which version of Windows you are using, you can continue successfully to use the serial port or you may need to purchase the USB adapter ($100) for seamless installation and compatibility. We have provided the table below to help you better assess your needs:
| Operating System | Serial COM Port | USB Adapter |
| Windows95 | may work, not recommended | will not work |
| Windows98 | works well | works well |
| WindowsME | works well | works well |
| WindowsNT | will not work | works well |
| Windows2000 | will not work | works well |
| Windows XP | will not work | works well |
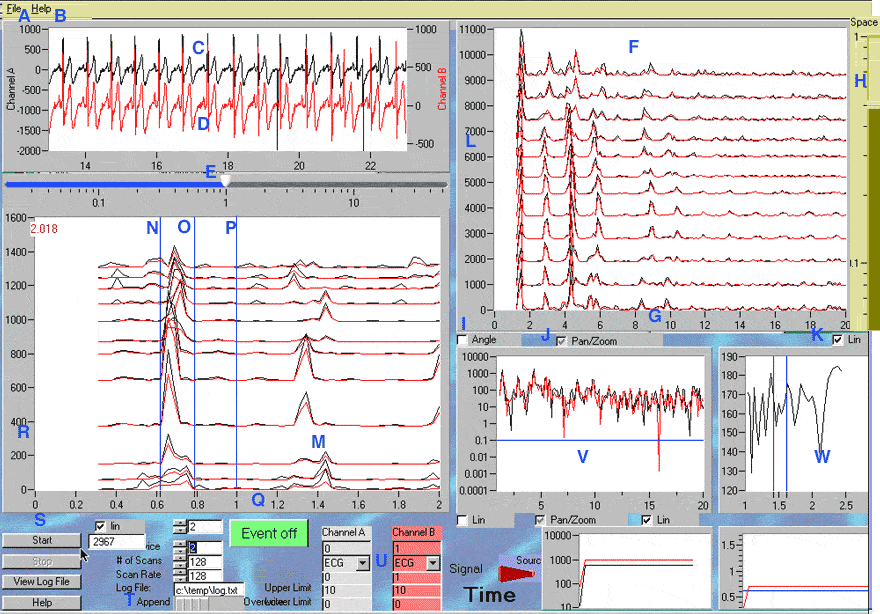
Screen Display User Explanations (by Code Letter):
A. Under File Menu pulldown, options include : Open - existing data file for redisplay, Save and Save As to store data files from most recent session., Close, and Exit Commands.
B. Help Files: Refer to this document.
C. & D. Raw voltage data display for Channel 1. (Black), Channel 2. (Red.). Note the RED Channel user is ALWAYS the cable plugged into the device next to the little lite bulb on the front of the hardware device. The bulb lights RED during device initiation, and blinks during shutdown. The RAW display of voltage is similar to EKG, ECG - when connected to the wrist electrodes. Brainwaves, and also lifeforce plant and electrosmog voltage displays are also possible here, depending on which transducer is plugged into the HeartTuner, and also depending on the GAIN control setting (see U. below.).
E. Slider control E. sets the RELATIVE gain on the RED channel. This allows 2 users to balance their relative input raw data for more balanced autoscaled data displays in the harmonic 'waterfall' plots. A small adjustment is useful here if the RED or BLACK user has a weaker heart voltage input signal. This can be caused by many variables including skin conductivity, wrist strap tightness, and of course heart strength - even body fat affects the heart voltage at the skin. Remember, moving this to the RIGHT INCREASES the GAIN on the RED channel. When comparing Heart with Brain phase lock, it is recommended you set the U. gain control to EEG for the RED channel, then AFTER the signals have gently stabilized (no head movement for more than 5 seconds or so), gently adjust this E. slider for the RED channel up and down to the RIGHT roughly 75 to 95% of the way, until gradually you begin to see come coherent harmonics in the (Ref) brain wave spectra (graph F.). The higher ratings on this slider should never be necessary for ECG work in both channels, but useful when in the HIGH gain EEG modes (switch U.).
NOTE ABOUT AUTOSCALING HERE. ALL of the plots in the HeartTuner displays are AUTOSCALED. This means that the relative height or amplitude of all displays automatically adjusts itself to maximum display resolution depending on the averaged input signal size. This is very useful in one important respect in that even when input signals are very low OR very HI the display will auto adjust to give you the most visible graph space possible to SEE the SHAPE of your data wave. Because of this feature however, it is very important the user understand, that WHENEVER you get a BIG noise peak (typically your subject has moved suddenly), the data display jumps to lo resolution to display THAT peak (which is probably NOISE). The solution is PATIENCE. Be still and wait for the data the re-settle to a nice baseline. In some cases on the 'waterfall' plot harmonic displays ( F & M ), this means waiting until the whole SERIES of plots where the noise happened scroll up off the screen (10-15 plots can take a minute or two.) Also remember that even noise your cannot see initially (like lots of room static electrosmog at a higher frequency), CAN effect the autoscaling. If you suspect you have some higher frequency noise, try clicking the LIN versus Log plot switch (at K. and to the right of S.). First on then off.
F. Standard Power Spectra harmonic 'waterfall' time history plot. This is a common way to analyze the 'musical' harmonics present in a biological signal. The bandwidth here from 2-20 hertz is the same window (or 'radio station' tuner waverlength) used to study brainwaves (Alpha, Theta, Delta,), used to study Heart Coherence , and used to study the Shumann resonance lo frequency planet magnetic 'heartbeat'. HOW TO USE THIS PLOT: This plot can be double clicked to expand to a FULL SCREEN display (as can the M. 2nd or Septrum coherence plot bottom left.) To close the full screen view, just click close in the standard windows top right 'X' box.
G. Is the 'cycles per second' or hertz of each of the 'musical note' harmonics contained in your heart or brain or plant, displayed with time history (waterfall).
H. This vertical slider bar controls the AMOUNT of space vertically between graph lines in the vertical waterfall of both Power Spectra, and Coherence displays. We recommend approximately 80% for the initial setting here.
I. Angle Checkbox. When checked causes the vertical waterfall display plots to cascade at an angle - 'walk' gently to the right as they are plotted up the screen.
J. The Pan /Zoom check box. Checking this box alternately, allows you to ZOOM - that is click on the SCALE numbers of the harmonic display (G.) and drag it right or left. This allows you to see higher frequencies displayed (up to 100 hertz or so depending on sample rate.). This is particularly important when checking for enviornment electrical noise ( There is a 50 - 60 cycle filter built in - nominally set to 50 hertz. If you need 60 hertz filter - U.S. it is located in the Device.ini file ). Clicking on the Pan/ Zoom again allows to to use the mouse to drag select ANY area in the rolling graph and ZOOM in to plot ONLY that area. If you zoom in too far and want to reset, just click the Lin/Log toggle K. on then off.
K. The Lin/Log toggle check box, allows you to display the harmonics as a Log plot instead of linearly. In effect this makes higher frequencies visible in one plot, but compresses the right hand side of the plot together with somewhat less viewing resolution. Generally again, this is useful for checking higher frequency environment noise and electrosmog, but is usually OFF when viewing heart and brain harmonics.
M. Is the graph display window for COHERENCE and musical KEY. This graph is unique to HeartTuner, based on application of the second order FFT / Power Spectra (Septrum) to the measure of coherence in biological and general signals, pioneered by Dan Winter. The waveform of the first order PowerSpectra is input to a second order FFT/Power Spectra (Septrum). The waterfall time history display presents a powerful new way to learn about COHERENCE in yourself, or and living thing. The AMPLITUDE or height of the first peak (left) of this display is the measure of coherence. If the harmonics of the first order Power Spectra get into a nice evenly spaced 'cascade' or musical chord, then this peak grows. We explain to kids, that learning to get COHERENT in your HEART (literally coherent emotion / emotionally intelligent), is like learning to turn your Heart from a flashlight into a laser. It's beaming reaches farther. Try this trick, connect yourself to the HeartTuner, get relaxed and peaceful, then glance for a second or two at someone you genuinely are feeling LOVE for, and watch this peak. Tell us what you see?
We believe that, while the medical literature is right, that being stuck in one frequency is a bad health indicator, that the heart still chooses COHERENCE by inviting MANY harmonics into itself ALL in phase. This process of perfect non-destructive branching in nature is called PHYLOTAXIS and is based on Golden Ratio. This does not mean that your heart always wants to be including so much of the world in its beat electricity. It does mean that, you may wish to gently learn the FLEXIBILITY to move up and down this EI. scale.
The first game to play with the HeartTuner is thus simple. Learn to RAISE this coherence peak. Many experiments suggest this peak only goes up (shows COHERENCE) when your heart is HAPPY. It appears this MAY replace muscle testing as a way to check to bodily approval. (kinesiology measure). We have noted repeatedly that this peak goes up when you SPEAK YOUR TRUTH.
(Q.) Secondly, the numeric value (position) of this peak (the Q. scale) is called the E.I. Emotional Index number. And is displayed at the top left of this graph. This number, corresponds to a.) the inverse of the MUSICAL FUNDAMENTAL (Musical Key), of your heart 'realtime'. (With profound implications for re-tuning your bliss music - see the Heart Valentine Game Heart Music output). Also, b.) this number corresponds to the inverse of the average distance between harmonics in the Standard Power Spectra above. The powerful 2nd, thing to learn using HeartTuner is to move this peak at will. If you need help, try doing something to move your heart RATE. At first, ability to get heart rate flexing is related to people learning NOT to be couch potatoes. Later, this heart muscle flexing (Heart Rate Variability / HRV ) becomes intimately tied to your abililty to fire your heart for EMOTIONAL reasons.
We call eliciting this - LEARN COHERENCE - then LEARN to FLEX EI. up and down - the 'Come on Baby - Light My Fire' response!
The 3rd recommended GAME to play with this scale, is for 2 people to learn to synch up their heart music. When the peak (EI) of two persons match, they are said to be 'HeartLinked'. This means that 'getting on the same wavelength' for sharing feeling, MAY now be measureable. This has profound implications for EMPATHY training, counseling, conflict resolution, and also romance and tantra. The technical term for this 'entrainment' on heart harmonics which the HeartTuner makes measureable, is called 'micromotion entrainment' or 'impedance matching'. What happens is that when the biggest electrical circuit (the Heart) of 2 bodies phase locks, it is possible for them to efficiently exchange CHARGE. This becomes a vehicle for profound direct 'faster than light' biological communicating. 'All human interactions are about CHARGE' - Celestine Prophecy. Read more about charge entrainment and life force. (Ref. Lifeforce Article) - These experiements make it possible to use HeartTuner to check when you have sent love or emotion to a tree or plant as well .
The 4th Game to Play involves the GEOMETRY of this EI Number Musical Peak:
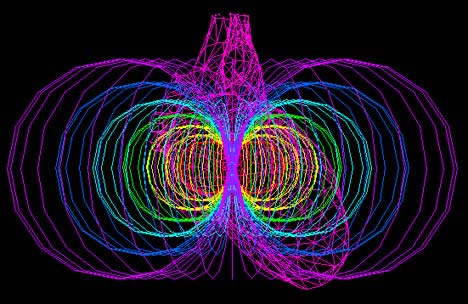
N. O. & P. Blue lines on the Heart Tuner Screen. Correspond to E.I. numbers ( & musical fundamental inverse) of N. = .618.. Golden Mean Ratio, O.= Abouve .79 the Square Root of .618 Golden Ratio, and P.= EI of 1.0. Experience with thousands of users of the HeartLink and HeartTuner has shown that a large percentage of people when they stabilize are stay somewhere for extended periods in EI. or heart music KEY (tuning), they USUALLY choose ONE of these three places. Naturally, we began to ask questions about why this was so. Geometrically, the electrical shape of the donut voltage waves firing the heart would be CUBIC when this is 1.0. Versus when it is at .62 that lattice structure of the heart's electrification would be PENT. Cubic structures CREATE membranes, PENT structures BRIDGE membranes. Psychologically speaking BOTH SKILLS ARE USEFUL.
We asked many people to characterize the EMOTION associated with these positions, and a table was prepared subject psychological input from groups in Spain and California:
This table should NOT be taken literally. It is subjective. However it is true that emotional openness is probably more associated with .62 EI. Yet NO user should feel frustrated about moving up and down there, because - there are many psychological and physical needs that vary this heart rate music related phenomenon.
In GENERAL terms, the left blue line (.62) probably does suggest a little more tendancy to OPENNESS and TOUCH PERMISSION. The right Blue Line (1.0), suggests a bit more structure making, and intellectual satisfaction. The center line (square root PHI ), is subjectly suggested to relate to a peaceful balance stability between the wet making membrane (.62) and the hard making/ structure making membrance (1.0).
--
S. Start / Stop / View Log File Button. Click start to begin displaying data. Click Stop to shut down data. It is important to click STOP to shut hardware down, before quitting program, or you may need to unplug / replug HeartTuner in to computer, to reset - when you restart HeartTuner. (Hardware red light comes on at START, and blinks white- during shut down.).
NOTE: THE STOP BUTTON ON THE HEARTTUNER SOFTWARE TELLS THE HARDWARE TO DO AN ORDERLY SHUT DOWN, WHICH YOU CAN CONFIRM BY NOTING THE WHITE BLINKING LIGHT. IF YOU TRY TO RESTART THE HEARTTUNER SOFTWARE, WITHOUT AN ORDERLY 'STOP' SHUTDOWN, YOU MAY GET AN ERROR MESSAGE (unable to access hardware). IF THIS HAPPENS, MERELY UNPLUG THE CABLE TO THE COMPUTER FROM THE HARDWARE, WAIT 5 SECONDS AND RECONNECT - THEN PROCEED.
T. Selects WHERE the data log file will be stored. Note this log file is called log.txt. This allows to to click 'OPEN" under file - then browse to this raw data file, and then replay and re-analyze full data session files. NOTE: IF YOU WISH TO KEEP THE RAW DATA FROM A SESSION EITHER RENAME THE log.txt FILE AFTER DATA 'STOP' COMMAND, OR HIT SAVE-AS UNDER FILE AFTER DATA STOP. OTHERWISE, EVERY TIME YOU RE-CLICK THE DATA 'START' BUTTON, YOUR log.txt RAW DATA FILE IS OVERWRITTEN.
This switch also controls where the EIdata.txt file is stored, which contains only the recent EI and coherence number. This is important to allow import to game (Heart Valentine) software to import interactively. NOTE: IF THIS DISK ADDRESS IS SET TO A FOLDER THAT DOES NOT EXIST, YOU WILL GET AN ERROR MESSAGE ON START.
Your raw data file log.txt contains ALL the input numbers. The EIdata.txt file is only updated interactively with the last EI and coherence number measured (keeping only 1 pair of numbers at any time) to allow GAME programmers easy access. You are invited to examine and learn about both files by opening them in Spreadsheet software (like 'Excel' or 'Lotus' etc.).
U. Sets each channel GAIN from standard (ECG) to High Gain (EEG). EEG / Hi Gain is also used for plant / tree/ life force measures (capacitive). Inductive (coil input) electrosmog measure can use lo gain (ECG). Use Hi-gain only when you are sure you are not over saturating the pre-amp - IF THE RAW DATA (channel A /B top left) is over 5 volts plus or minus - then your gain may be too high. Recommend setting the RED right channel 2. to higher gain EEG / when comparing ECG to EEG - for head / heart link up training.
IMPORTANT NOTE: BECAUSE THE HEARTTUNER TAKES THE GAIN INPUT CONTROL TO SWITCH THE DEVICE INITIALIZATION PERAMETERS - ALWAYS SET YOUR GAIN BEFORE YOUR BEGIN YOUR FIRST DATA START. IF YOU NEED TO CHANGE THE GAIN, IT IS NECESSARY TO STOP THE DEVICE, QUIT THE HEARTTUNER SOFTWARE, THEN RESTART THE SOFTWARE (restarting computer should not be required).
V. An additional linear / log scale display option for Harmonic Power Spectra (without time history waterfall).
W. The IDENTI-PHI software concept / proposed by Dan Winter, and written by Dan Kunkle (do see BioWaves.com ) allows user to see CASCADES where harmonics proceed by a series of wave length MULTIPLICATION RATIOS. A PHI cascade 'chirp' or heterodyne' -like a caddeuceus input, would show up here (blue lines at .62 versus 1.0, versus 1.414 - square root 2). HeartTuner software will soon be linked to sound healing software! Missing heart harmonics, 'healed in sound', and vice versa.
X. Heart Rate Variability display - (example plot above). Heart Rate Variability (HRV) is one of the most important measurements of heart health known today. By displaying HRV more dynamically (faster refresh time) the HeartTuner is 'state of the art' in helping users FEEL almost 'real time' how to change it. HeartTuner displays HRV for one channel at a time (2 at once would complicate the display and slo down CPU response). The button at X switches which channel (person A or B - B is the one plugged nearest to the red 'ON' light) is seeing their HRV. Note here: it takes fully about a minute for HRV data to appear since it takes that long to get nice lo frequency data input. Since this averaging will carry over when you switch users, expect to wait a minute or 2 before expecting the HRV display to reflect the NEW user - NOTE: We recommend you simply hit STOP, wait 10 sec. for device close. Then switch HRV channel input X. Then START the data input again. NOTE: ignore the HRV display when you are measuring brainwaves or other 'life force'/'electrosmog' inputs.
Y. Heart Beat Interval (Interpeak time graph) / 'Tachogram'. This display (channel A OR B depends on switch X for HRV) goes up and down to reflect the time (milliseconds) between heart beats. Breathing IN raises heart rate slightly, OUT decreases it. As a result, THIS GRAPH BECOMES IN EFFECT A BEAUTIFUL WAY TO BECOME CONSCIOUS OF YOUR BREATH - AND IT'S NICE GENTLE WAVE BECOMING 'NESTED' TO YOUR HEART HARMONICS. see HRV and breath.
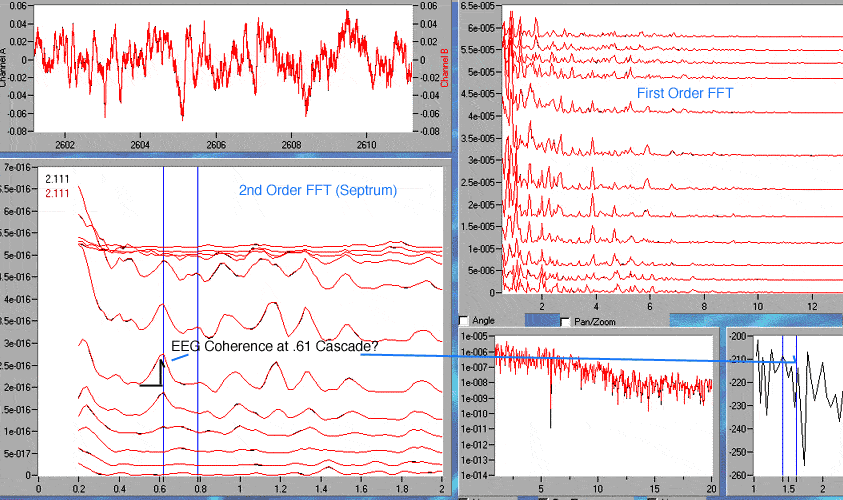

Measuring Brain coherence may have profound implications for the teaching of ATTENTION . see Attention Deficit and Addiction article.
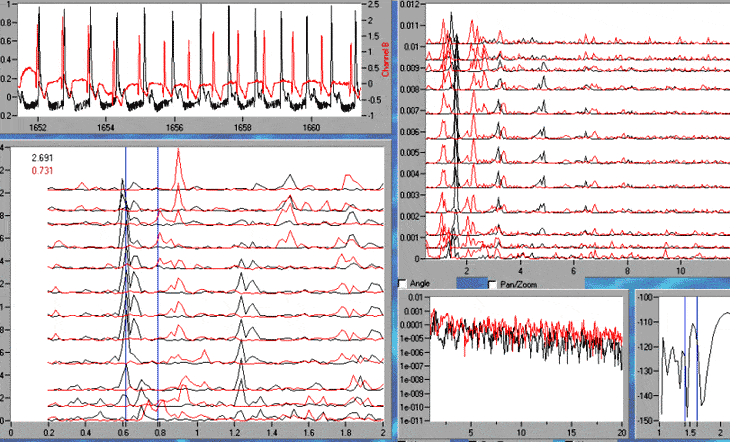
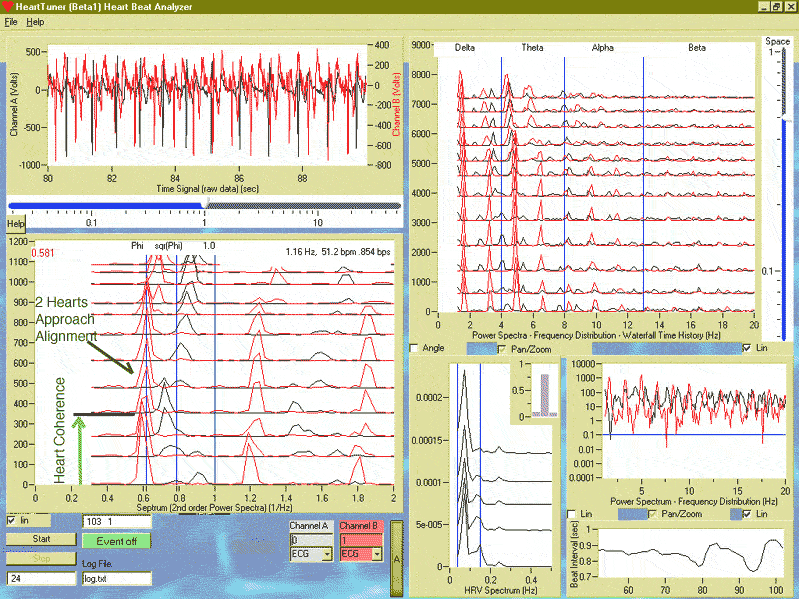
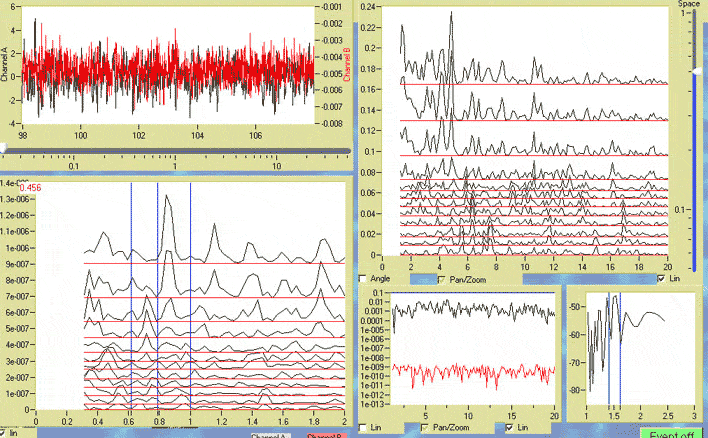
ABOVE: TEACHING 2 PEOPLE TO LINK HEART's MUSICAL FUNDAMENTAL - Using Heart Tuner...

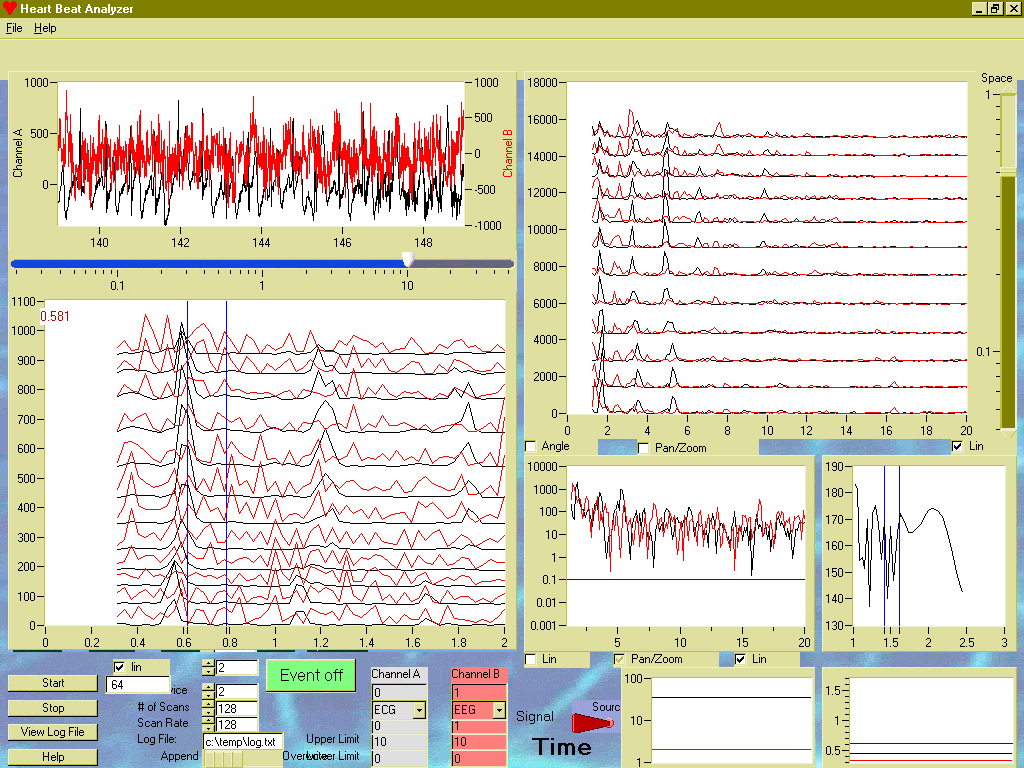
ABOVE: Same 2 People Not Quite Acheiving EEG BRAIN Coherence, Measured with Heart Tuner
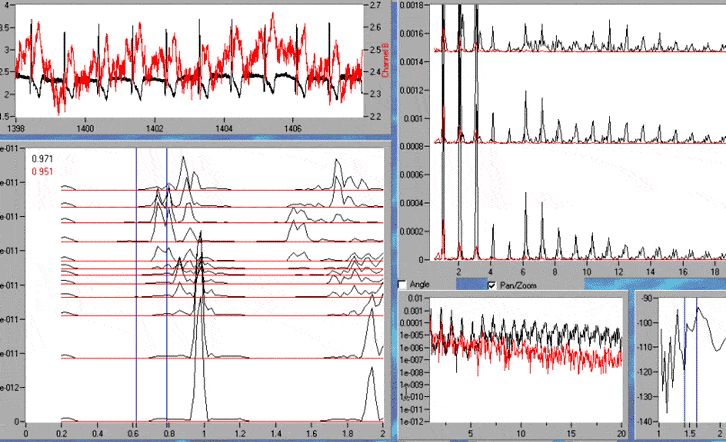
Above: Connecting 1 Heart, 1 Brain of the Same Person shows some link up (heart brain connection) particularly in the first order fft (top right)
Note 2nd order fft (septrum) showing amount of coherence,(1st peak amplitude) and musical fundamental (1st peak position) is always lower left.
--
Below : Friends visiting -
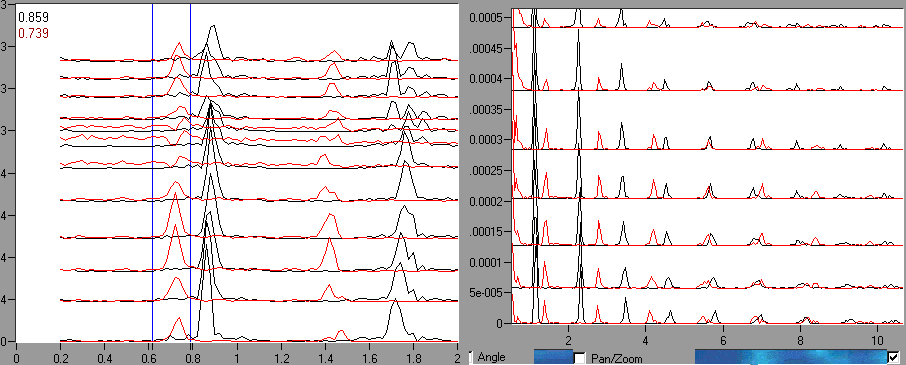
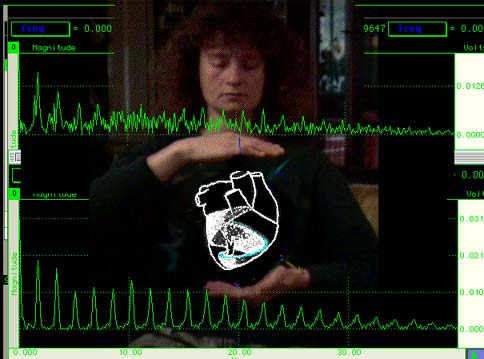
Here is Professional Mediator and Friend - Testing Heart Tuner Ability to Link Hearts- (See lower left peak) - Here they achieved coherence, and approached but did not quite acheive actually getting 'on the same wavelength' (musical fundamental).

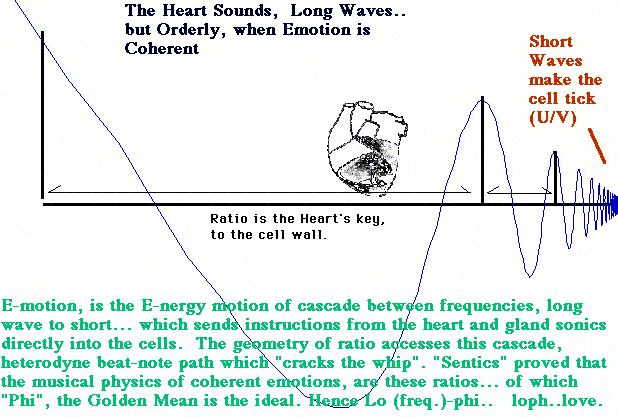
The problem the heart encounters, in order to become literally 'a sustainable wave' are the same problems a plant must face, and the heart's solution is the same as the way plants branch out into the world. A scientist's definition of a wave that is able to sustain itself, and thus "be able to go far", is called COHERENCE. You can understand coherence for yourself (while visualizing soldiers deciding to try ALL MARCHING IN STEP WITH EACH OTHER) by thinking about the difference between the beam of your battery operated flashlight, versus the beam of a LASER. Coherence for a laser beam means all the waves are PHASE coherent, and thus in a sense 'do not fight with each other' ; they NEST WELL.
So you would think the goal for a heart, in order to last forever as a wave ( a kind of medical definition of immortality if you will humor us here), would be simply TO GET COHERENT.
But there is a trick to this problem. Recent cardiologic evidence is quite clear, the WAY the heart statistically eliminates most chronic diseases, and apparently AGING itself (!), is by getting itself into as MANY DIFFERENT FREQUENCIES AT ONE TIME as possible. Here I am referring to the wonderful and ground breaking article by Dr. Irving Dardik, from Cycles Magazine (reprinted for convenience at soulinvitation.com/dardik ), which showed that FRACTALITY or HARMONIC INCLUSIVENESS was the direct statistical correlate to healthy heart. And that loss of this perfect NESTING or SUPER-LOOPING as he called it, was the precise statistical predictor of so many chronic diseases AND aging.
So here is the problem your Heart faces:
In order to get a sustainable wave (longevity in sense), it has to make a COHERENT wave.
and yet:
In order to qualify for the math contest which says : LONGEVITY only goes to the FRACTAL or WELL NESTED or HARMONIC INCLUSIVE heart,
your heart has to find a way to INCLUDE AS MANY DIFFERENT FREQUENCIES AS POSSIBLE!?
We probably don't need to remind ourselves that being FRACTAL in your Heart Harmonics, and your Heart Rate Variability, has been made famous, and a buzz word, by such great's as Dr. Ary Goldberger. (His work on Self Similarity / fractality in the Nerves which fire the heart for example). Dy. Goldberger has established a powerful research organization entirely devoted to this idea of FRACTALITY in the heart. ( see: http://reylab.bidmc.harvard.edu/people/Ary.html )
Self-similarity appears to be identical with perfect embedding, with perfect wave fusion, with perfect fractality, and with perfect compressibilty (not to mention sustainability and ability to self-organize and become self aware). We have written much about this ( reprints: soulinvitation.com ) particularly the articles on FUSION , on EMBEDABILITY , on SCALE INVARIANCE, on PERFECT WAVE COLLAPSE, TUNNELLING , on ARTIFICIAL INTELLIGENCE, ETC,
So here is the rub: usually if you ask a scientist HOW DO I GET COHERENT, he will say: well get one frequency going, and do it really all in sync.
Yet if you ask a cardiologist WHAT HAPPENS TO A HEART EKG when it settles into one single simple harmonic frequency: the answer will be simple and blunt: this would mean you are about to DIE. So while a heart does need to get coherent, it obviously needs a different KIND of coherence which enables it to get a large number of waves of DIFFERENT lengths into CONSTRUCTIVE phase alignment.
This IS the principle of perfect compression literally, which FRACTALITY solves. Lots of waves, which don't hurt each other all in one space. Dr. Dardik called this SUPER-Looping, I have also discussed this as NON-Destructive COMPRESSION - which is how you get charge compressed in order to stay in one place. (Something which I will below suggest is key to how we measure life force.)
Compare this to Dardik's idea of what makes the heart sustainable as a wave:
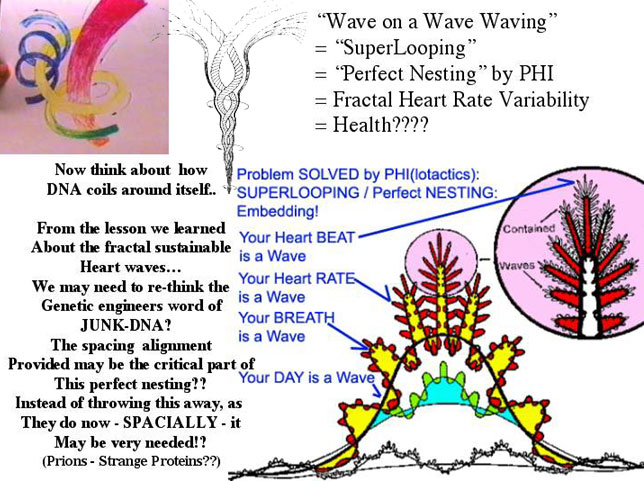
Dr. Irving Dardik M.D. originally described the mechanism to health involved getting more waves superposed in the Heart The Origin of Disease and Health Heart Waves The Single Solution to Heart Rate Variability .m
The words he used are useful. Super-LOOPING or NESTING.. describe the way the heart BEAT as a wave, must survive or non-destructively NEST inside the heart RATE as a wave, which must NEST inside the BREATH (& HRV!) as a wave, which must NEST non-destructively inside your DAY as a WAVE. In fact by downloading your day as a heart RATE curve from your special wristwatch, to your computer, he was able to RETUNE people's daily living pattern by proposing life style changes to affect HEART RATE FRACTALITY. In so doing, he healed enough diseases to upset the American Medical Association.
The point is that even having 1 coherent peak inside the HRV (Heart Rate Variability) is not the solution (as the simple operation of breathing in a single frequency is about the extent of what you learn wiith Heart Math's "Freeze Frame".) The challenge is that COHERENCE means waves that are all in phase with each other. Mathematically, coherence is possible in only 2 environments:
1. A Single Frequency (Clearly death the fractality and life in the heart, contrary to what Heart Math "Freeze Frame" implies by showing you simple coherence as the goal.)
2. A NEST of a potentially infinite number of frequencies all coherent (in phase) with respect to each other, based on SELF SIMILARITY (Golden Mean Ratio). In this latter geometry, you can be BOTH - COHERENT AND FRACTAL. This explains why so many peoples EKG musical fundamental (as revealed by my HeartTuner / HeartLink in the 2nd order FFT - EI number) so often goes to a mulitple of GOLDEN MEAN RATIO, when they leave the membrane making / separateness making OCTAVE ratio 1 hz EI number. Essentially this is a move from touch inhibiting - to touch permissive electrical geometry around the EKG.
What was needed was a way to make this measureable in the EKG.
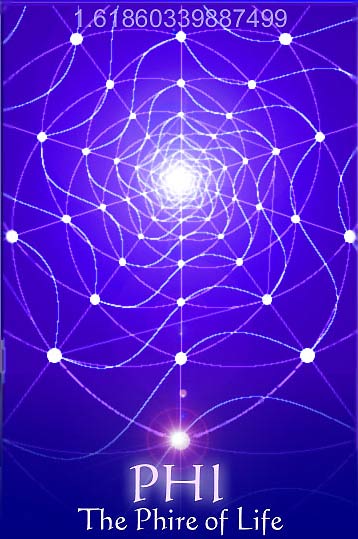
2 insights solve this problem. The first insight is that when nature solved this problem (for every growing plant) it was call PHYLOTXES (for Phi - the Greek symbol for Golden Ratio. Nature uses this perfect branching based on the Golden Mean number (.618...), because it is perfect packing and perfect unpacking, and it is the perfect way to share space (like sunlight shared among leaves), and thus perfect compression. Please see the many lovely graphics of the physics of phi and philotactics etc... PHYLOTACTICS , PHYSICS OF PHI , BEAUTY GENES, PREDICTIONS , as well as the wave interference optimized definitions of PHI in HETEROPHI, etc.
The second insight is that if you were to take a spectrum analysis of the perfect phylotaxes branched tree or fern, you would get A HARMONIC SERIES BASED ON THE GOLDEN MEAN RATIO.
This began to shed useful light on what we had been observing for years on the HeartLink. Namely, that most peoples heart harmonic series, when stabilized would 'hang out' at (musical fundamental 1/X, where X is the EI number -emotional index - as displayed on HeartLink) -
either : .618 , or square root of .618 , or 1.0 . And further that most often when people were in heart harmonic space based on the cubic lattic geometry of 1.0 EKG musical fundamental, they would report HEAD centered (we later call them MEMBRANE MAKING) emotion. Versus when the would settle at multiples of the Golden Ratio, THEY WOULD REPORT FEELING MUCH MORE INCLUSIVE AND TOUCH PERMISSIVE IN THEIR EMOTION.
The point is, even if this conclusion is so radical as to be revolutionary to you, the new Heart Tuner, by making this visible, makes it observable, and now probably teachable.
Another way to say this, is that my insight was to solve the mathematics for what permitted heart harmonics to be, as he so well said, "a wave within a wave waving" nondestructive to each other. What I determined was that a cascade of harmonics, related to each other by the Golden Mean or PHI, would PERFECT this nesting. (To QUANTIFY EMBEDABILITIY). The Heart Spectrum Analysis - 2nd order power spectra can measure this and make it teachable.
In Summary: Implosion in the Heart "Sings" a Music That is Measureable..
Then: How the HeartTuner works. (current HeartTuner screens at bottom here) What it does:
1. Measure Coherence in your Heart (Teach Coherent Emotion - 'Hearts: From a weak light into a laser') ,( Preliminary Evidence also Suggests this Coherence Measure may make scientific the muscle test of kinesiology. stream video: http://www.soulinvitation.com/kinesiology )
2. Learn Emotional Flexibility (Fractality) by Teaching RANGE OF EMOTION (Move the E.I. Peak up and Down).
3. Learn Empathy / Compassion - learning to 'Get on the Same WaveLength' by aligning Musical Fundamental of 2 Hearts (E.I. Number Phase Lock / called 'micromotion entrainment' / 'impedance matching' ) Implications for Empathy Training, Counselors, and Lovers etc.
4. Participate in Experiments among thousands which have suggested that Moving the EI Number (Heart musical fundamental inverse) FROM 1.0 to .62 (Golden Mean) corresponds to Moving from HEAD CENTERED EMOTION (Intellectual Satisfaction / Membrane Making), to HEART CENTERED EMOTION . (Open-ness / Harmonic Inclusiveness / Membrance BRIDGING / Fractality / Compressibility).
5. Measure COHERENCE in BRAIN EEG. 1 or 2 Channel. (2nd order FFT of Brain Waves to Measure Coherence or AMOUNT OF FOCUS has never before been available. - Implications for Attention Deficit and Addiction Training etc.)
6. Measure for COHERENCE and ENTRAINMENT BETWEEN 1 BRAIN versus 1 HEART. (Yours or...)
7. Experiment to Measure if Coherence and Entrainment / LIFE FORCE? is Measureable in Trees or Plants or Anything Alive / also ability to measure the Phase lock between tree or plant or living thing, with your Heart or Brain. Implications for Feng-Shui Measurement, Dowsers, Ley Line Mapping. (Note HeartTuner's used with the optional Capacitive Transducer for Measuring Charge Radiance Harmonics will show which living trees for example can hear the Schumann Resonance, it will not show directly the geometry of a ley or magnetic line, but it WILL show which living things are being well fed BY the magnetic line. )
8. Distribute your Heart or Brain or Plant Music over the web with friends to find out WHO IS ON THE SAME WAVELENGTH! Implications for Prayer, Meditation, Peace Groups, Corporate Concensus Process, Peace Making Among National Leaders, and Planetary Heart Link Up / Healing.
9. Play the "Love-Bug" Valentine Speedometer Game with Someone you Care about. (& many other Games Under Development).
10. Play the Actual Wave Music of your Heart in Audible Music - Your Bliss Song. (Under Development).
 (EMBEDABILITY
illustrated using the HEARTLINK hardware and software concept
before the Andrew Junker contracted version)
Below is a screen display of the newly announced version of the HeartTuner . Note that in addition to the waterfall display time history comparison of 2 person heart harmonics (fft) over time on the top right, on the lower left, the septrum waterfall displays both persons 1. Amount of Coherence (peak amplitude), and 2. Musical EKG fundamental - and thus when they are on the same wavelength - which has already been seriously linked to EMPATHY, and 'getting on the same wavelength'.

ABOVE: TEACHING 2 PEOPLE TO LINK HEART's MUSICAL FUNDAMENTAL - Using Heart Tuner...

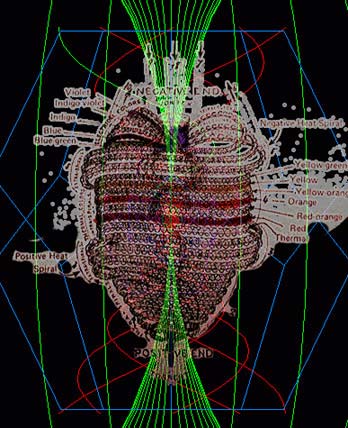
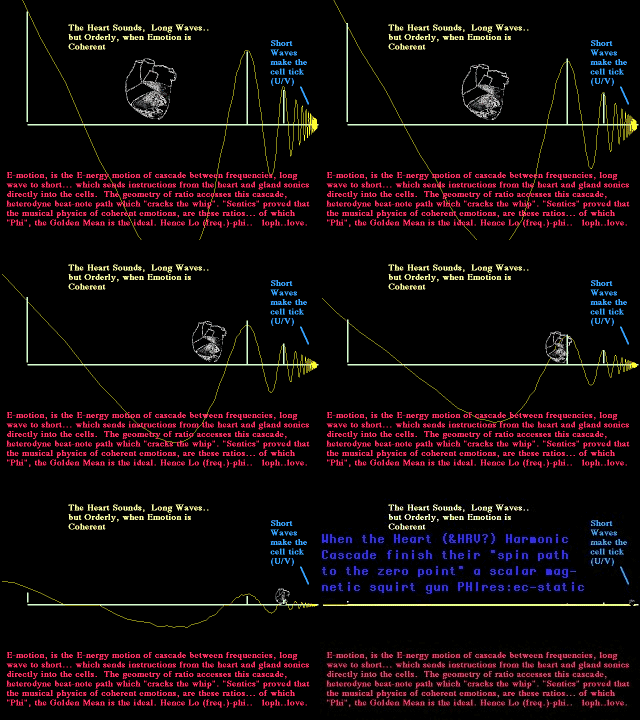
This amounts to a 3D rotating caddeuceus below, which creates the IN-PHI-KNIT embedding we have described as the origin of the holy grail.
essentially this involves a consequent GOLDEN MEAN BASED harmonic series to add and multiply their wave front velocities thru the speed of light into time (ensoulment)
(as measured by William Pensinger from Santa Fe, in the superluminal /faster than light signal propagation velocities along the long axis of DNA.)

the way this caddeuceus of frequency harmonics in a CASCADE revolves to send waves upward in harmonic velocity to the ECK-STATIC (charge stasis)
is shown in this animation
Perspectives on HeartTuner:
In ancient language to be blessed with Barrakah is to be given the spirit needed to blossom and prosper. You may congratulate yourself with Barrakah for the blessing of having chosen the HeartLink biofeedback system. In effect you have given yourself a new and amazingly powerful tool, to allow you to better wrap around yourself like technicolor coat, a 7 fold rayment of CHARGE. You are embarking on a quest to help your heart choose the skill to better holds its field effect. Prepare this field, and "she" will blossom and prosper. If we take seriously the modern addage that magnetism is the wind on which love travels, then better assembling the heart's constructive waveform in a nested envelope of capacitance, you indeed empower yourself with "Barrakah".
The idea behind the HeartTuner is so simple, it is amazing it has not been taught before. The healing literature is clear that the more harmonics of waves of charge that you can get woven simultaneously into your hearts electricity, literally, the healthier you will be. This is called Heart Rate Variability or HRV. ( see hrv for HeartLink article ). Essentially, to arrange your heart's electricity into a wonderful ALL INCLUSIVENESS, invites in LOTS OF SPIN. This is simultaneous with what it takes to invite in LOTS OF FEELING. (Compassion for ALL.)

The profound meaning of arranging your Heart's waves (heart rate variability/HRV) into this kind of FRACTAL has been written up by Dr Irving Dardik MD. He shows that by getting the heart's "wave waving within the wave" (heart beat as a wave within the heart rate as a wave, ... within the universe as a wave?) all in a nestable way, medicine concludes that you will clearly create resistance to almost every known chronic disease.
The HeartTuner biofeedback system, is essentially the embodiment of the intuitive flash, that the HARMONIC RATIO of the heart's contained wavelengths BECOMES EMBEDABILE or NESTABLE in the RATIO of the GOLDEN MEAN, it is then that the heart waves become SO WELL INTERWOVEN AS TO BE MATHEMATICALLY ALL INCLUSIVE. This is based on the principle of best packing or nesting or tree branching in nature called PHIllotaxis. (after PHI the symbol for the Golden Mean Ratio, which is simply the branching technique for the best way to share space FOR ANYTHING.)
So by taking an analysis OF THE RATIO BETWEEN the contained harmonics in the HEART, using a special technique called double frequency signature or fft, we can look for the first time at two radically wonderfully new properties of your heart (OR EXCITINGLY potentially ANY biologically oscillator being taught in this way to become self referencing, which IS self organization, which IS self-awarness.)
1. The height or amplitude of the first peak of the second order frequency signature displays THE RELATIVE AMOUNT TO WHICH THE HEART IS COHERENT AT THAT MOMENT. This then is a way to learn to hold your heart LIKE A LASER. It is called, "coherent emotion". (Emotional INTENSITY.)
2. The POSITION of that same peak (called EI or "Emotional Index"), is literally the spaces in the heart, AND CORRELATES TO A TABLE GATHERED FROM HUNDREDS OF EXPERIMENTS which shows LITERALLY THE NATURE OF THE EMOTION OF THAT MOMENT. (Emotional QUALITY.) When this peak is at .618 the Golden Mean for example, consistently it correlates with the feeling of WONDER AND LOVE, indicating success in learning EMOTIONAL RANGE OF MOTION from the HEAD (1.0 = Intellectual Satisfaction), to the HEART!
This all important display of the HeartLink, among 4 dynamic waves updated several times per second for up to 2 people (in the 2 channel version), is called HEART COHERENCE.
Section 1.
Unpacking, Installation and Setup.
The HeartTunerSystem includes
1. The HeartTuner Module (preamplifier/input A-D etc.),
2. A cable to connect that to the Com or Serial port on your PC compatible computer.
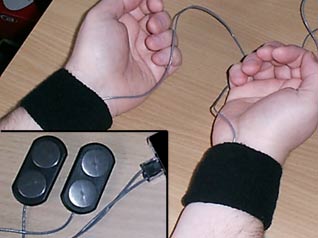
3. 2 EKG Wrist Electrode Pairs - Transducer Harnesses which plug into HeartTuner to accept the snap in wrist electrodes .
NOTE: It is important NOT to user any conductive paste, under the simple wrist electrodes. They are to be held in place by a simple elastic wrist band - of the sort used by athletes. In rare cases it is necessary to prepare the surface of the skin with slight abrasive cloth using rubbing alchohol.
4. An extra pair of span in electrodes. (The conductive coating on them does last for many uses - usually at least hundreds or more.)
5. An Install CD to set up the software on your PC, along with the documentation on disk.
--
System Requirements:
Windows 98 or Millenium are compatible with the serial or USB port.
Windows 2000, and XP Require USB port adapter.
In order to install the software on your PC compatible computer you should run Windows ., you will need an available COM or serial port (like your
Note that your HeartTuner does indicate
your battery voltage. Recommend your 9 volt battery be replaced
if it shows under: approximnately 8 volts.
CONNECTING THE ELECTRODES:
Slide an Electrode, facing the skin, under a wrist band around each wrist. The electrodes should nicely hug the underside of the wrist.
Brainwave electrode Options: pending.
Running THE HEARTTUNER --------------------
RUNNING THE TRAINING SOFTWARE ------------------------
Later you will get used to fine tuning this gain control. You want the gain high enough to that the very visible wave peaks show on the TOP to graphs, YET NOT SO HIGH THAT ANY OF THE PEAKS ON ANY OF THE 3 MAIN DISPLAYS TOP OUT OR FLATTEN THEIR PEAKS "SATURATING" AT THE TOP OF THEIR DISPLAY WINDOW. In effect, if the top peaks of many of the peaks in the 3 main windows have little flat tops instead of sharp peaks, this means you are overamping or saturating and you should gradually experiment to adjust the gain downward slightly.
People who are slender have slightly higher surface heart voltages..(easier to read electrically could be an interesting metaphor..). Also body hair can reduce the connectivity. If you see a noisy screen, on the bottom HeartPulse, before you try repositioning or replacing the electrodes (usually unnecessary), try simply pressing very firmly on the stick ons themselves for a few seconds to improve the connection then releasing. This is also sometimes necessary if your subject has moved around, loosening the connection. It is important to try to wiggle the electrode arrangement as little as possible during actual data taking. If this does happen, there is no damage to the equipment, just wait a couple of seconds for the data to settle before adjusting the display or taking meaningful data.
We need to introduce the meaning of
the 4th and smaller display on the left center labeled HRV for
Heart Rate Variability. Interpreting this display is discussed
extensively below. This channel also features independant gain
controls for 1 or 2 channel use. The up and down arrow keys control
the gain for HRV channel 1, and for 2 channel users, the right
and left arrow keys control the gain for the second channel. Note
that the HRV display will only become meaningful once the user
has been still and breathing fairly regularly for more than 8-15
seconds or so. Once this is the case, and the HRV display has
stabilized into a fairly constant waveform, adjust the gain so
(often downward at first) so that significant ordered peaks do
occur, but so that they do not top out "saturating"
"flattops" at the top of the screen.
B. The EKG Harmonics Display
The second display to focus on, once you have adjusted your
heart wave amplitudes, is the top display labeled EKG
Harmonics. This display is a continuous measure of the
magnitudes of the harmonic content of your heat wave.
Note that as you perhaps focus on your heart and breath into
your back or imagine a sense of expansion in your back or area
around your heart that the Harmonic display begins to produce
a number of pulses uniformly spaced. This may look like a
display of a comb or a bunch of fingers. As your heart wave
produces more harmonics of the fundamental heart beat this
comb like shape will become more pronounced. This shape has
been described by some as 'pretty'. Thus you can think of
your task as to make the display more pretty. When you do, the
heart wave will be in a greater state of harmonic coherence
which may correlate with a sense of greater heart centering.
C. The EKG Coherence Display
As the harmonic content of the heart wave becomes more
pronounced this third display will exhibit peaks. The inter-
peak distance of this display may suggest the form or tone of
harmonic coherence the heart wave is exhibiting.
Note the inset bar display which provides a small yellow moving
square. Included are also some target values you may want to work
at achieving. Experience suggests that the different states (as
indicated by numbers 1 through 5) will produce different heart
feelings. The numeric position of this inter-peak difference (.618..
golden mean, vs roots of two for example) eventually become a
virtual INDEX to QUALITIES of emotion. For example; powers of
two: more containing/holding/thinking feelings powers of Golden
Mean: more sending and receiving kinds of feelings.. The powers
of 2 harmonic multiples here ARE MEMBRANE MAKING, emotions typically,
and are labeled RED on that slider bar ( positions 3 and 5, corresponding
with EI values of 1.0 and 2.0, which are powers of 2, literally
in"cube"ating emotions.) While multiples of the Golden
Mean Ratio (the most important .618 as 1/PHI is labeled 1 on the
slider. 2 on the slider is 1.618/2 or PHI/2 pr approx .81 value
for EI, Emotional Index. 4 on the slider is 1.618 or PHI itself
as EI.
The core of the display's usefulness then is twofold. Effectively, almost all information you need to learn heart intelligence IS CONTAINED IN THE POSITION AND HEIGHT OF THE FIRST PEAK IN THE CENTER EKG COHERENCE DISPLAY. The Height or Amplitude of that peak is biofeedback game 1: Increase the COHERENCE or SUSTAINED INTENSITY or FOCUS of your emotion.
Biofeedback game 2, which is emotional RANGE OF MOTION. Is to be able to experience the spectrum of emotions. To do this we look at THE POSITION OR NUMERIC VALUE OF THAT SAME FIRST PEAK OF THE SPECIAL SECOND ORDER FREQUENCY SIGNATURE WAVE (screen center) CALLED EKG COHERENCE. We also display the numeric value of the position of this peak as EI (for 1 and for 2 channel users), which is EMOTIONAL INDEX. Technically this is the inverse of the average distance between peaks of the top frequency signature. Literally this is spaces in the heart. Practically, from hundreds of users, this EI indicates quite generally the QUALITY OF THE EMOTION OF THE MOMENT. Preliminary sampling of large numbers of users (with help from Marysol in Spain et al) lead us to the follow important chart to INTERPRET THE EI: Emotional Index:
0.5 SECURITY/PLEASURE
0.6(18) WONDER/LOVE
0.7 SINCERITY/TRUTH
0.8 PEACE/OPENNESS (Phi/2)
0.9 WELL-BEING/REALITY
1.0 SATISFACTION/INTELLECT
1.2 HEALING/RECEIVING
In a general way there seems to be a clear pattern. The "CEO POSITION" for intellect and head centered is 1.0, where the spaces in the heart harmonics are literally cubic and membrane making. (Not to be distained either, since intellectual coherence is very necessary.) While Heart Centered feelings are nearer the .618 position. (membrane connecting/transcending vs membrane making.) For those wishing to sustain the trip from the head to the heart, a simple on screen display emerges as their EI spacing walks from 1.0 toward .618 ! Users are cautioned that ALL positions on the scale have value, and no frustration should accompany any feedback. Rather the skill is to learn: 1. COHERENCE, and 2. FLEXIBILITY. This is possible from ANY starting point.
Clinically we have emerging a major tool to help people learn to stay in their heart. Also we can help people actually see what makes their heart sing by learning to increase their EKG coherence peak.
The BOTTOM most graph (labeled "Heart Pulse") is simply the raw EKG or ECG heart voltage as you would see it anywhere. If there are two persons connected at the same time, usually channel 1 is blue and channel 2 is yellow. This color coding follows the two person through the other two graphs as well. Persons familiar with heart voltage will recognize the standard q,r,s & t subcomponents of the voltage wave triggering through the heart muscle.
The heart RATE is shown approximately for both person as well in the far top right and left of the bottom third of the screen devoted to raw ekg data. This rate will fluctuate some from actual if there are noisy harmonics or physical movements causing noise.
It might be well to make some general notes here.
The gain needs to be adjusted carefully. The slide bar under the raw data display top left... adjust the gain for the red channel. The < and > sign adjust gain for channel 2. The gain needs to be set so that the height of the black channel generally balances over time the red channel harmonics.
If a person moves around and creates electrical noise, it frequently takes several seconds for the data to restabilize, since there is some averaging of old data with new, even tho the screen display updates several times a second (depending on whether you are using one or two channel display, 2 channel slightly slows the refresh rate of course.)
When you begin to see the numbers in the actual display get distorted, simply press R for R(edraw).
Also, if your person wishes to try a certain breathing or toning, or even touching or hugging, be aware that the most interesting harmonic displays will often be just a couple seconds AFTER the test event... "they are not talking while the flavor lasts".
--
So..
Next the TOP graph.. (labeled "EKG Harmonics") is simply the harmonics contained in the raw ekg, displayed between about 0 and 20 cyles per second. This means that you are seeing which sine waves are "woven" together from 0-20hz to make the ekg. You could think of it as seeing which musical notes are contained as someone is playing a complex chord on the piano. Each peak is the actualy energy density of that heartbeat AT THE FREQUENCY labeled under the graph. This kind of display is sometimes described in various ALMOST similar ways as FFT (fast fourier transform), power spectra, frequency signature, harmonic analysis... All these label are roughly similar, and do describe what you are seeing.
A bit of history here, when we first saw that the harmonic content of the heart became ordered generally according to the way you were FEELING, ... AND we saw that the harmonics were often NOT nested in powers of TWO, Karl Pribram (author of Holographic Brain) said, he found it difficult to conceive of how we would (using the best of science) design an oscillator to perform like that! (This was on my second visit to the Heart Math Institute to show them how to do this ekg spectra work I pioneered at Millard Fillmore Hospital in Buffalo.)
Finally, the most revolutionary and likely most interesting .. the BOTTOM LEFT graph.. (labeled "EKG Coherence") (Co here and See?): Here we have developed an entirely new tool. We take the fft OF THE FFT! So we take the power spectra of the power spectra, in order to see the harmonic RATIO contained BETWEEN THE HARMONICS! Specifically here, we look at the first fft or spectra as a wave, and see what IT's harmonics (or fft) are.
Note well here, that the example graph shown above is an EXTREME example of success, in the case of a couple who have been meditating together 3 hours a day for 10 years. They were able to sustain this perfect .618 wonderful coherence/embedding indefinitely.. Most beginners just begin to learn they can grow the first peak or two on the middle graph, then quickly get the idea of how to make them grow by focusing on their heart and feeling state, and in a sense endeavoring to lead with their heart and not their head.
By taking the "second order frequency signature", we are ACTUALLY LOOKING FOR WHATS EMBEDDED! We have actually seen that when this second order fft of the ekg is taken such that the highest peak is PHI or .618, that the waveform of the second power spectra WILL LOOK LIKE THE EKG wave we began with! (Note to the mathematically oriented, we are NOT using INVERSE fft.) So the wave within the wave, looks like ... itself (the wave we began with.)

Expressing this to a layman is also simple: The height of the first peak of this second fft, is the EXTENT TO WHICH YOUR HEART IS A LASER (OR SONICALLY COHERENT) AT THAT MOMENT. The POSITION or number of that first peak of the second fft, is the INVERSE of the average distance BETWEEN the harmonics of the first fft.
Putting this in terms of the chord on the piano metaphor is also fun. The first fft was literally the notes of the chord. The second fft, tells you first:
1. whether the space between your fingers when you played the many notes of your chord was regular or equal interval (height of the peak)
and
2. what was the geometry or distance of the average spacing between notes in the chord. (the number or position of the peak)
So, when that peak is at multiples of TWO. The chord played by the heart is Octave like and literally "incubating". We have noted this with RED DOTS on the slider scale above right there, which moves to show you WHERE you 2nd fft peak is. We have begun to find, subjectively, that these kinds of moments correspond more the THINKING, LOGIC, CONTAINMENT, "INCUBATING" kinds of feelings. (A little more often characteristic of males..)
VERSUS
when these harmonics are multiples of the GOLDEN MEAN RATIO (.618), the BLUE DOTS on the sliding scale. We have begun to find, subjectively, that these kinds of moments correspond more generally to moments of:
a.) feelings of giving and receiving ..compassion
b.) feelings of wonder
c.) feelings of speaking your truth.
d.) "centering"
We also have begun to confirm that these power of PHI harmonics as heartbeats are more SUSTAINABLE (Sacred?) as waves than any other. This would correspond both to times when
a.) the NUMBER of harmonics which are visible and ordered is GREATEST in the first or TOP graph fft.
AND
b.) that sustaining of the harmonic ordering over the longest duration is greatest.
This would generally tend to support our hypothesis that massive and sustainable coherence is only possible in the presence of sustained Recrusion (embedding), optimized by PHI the Golden Mean Ratio. (Which allows those waves most CONSTRUCTIVE recursive interference/heterodyning.)
For further information on interpreting the HRV Heart Rate Variability section of the display and implications for measuring breath / heart phase lock please see ../hrv and ../brainfire
Using the HeartTUNER to Measure Harmonic Phase Lock from Heart to Brain:
It is possible to apply the revolutionary mathematical technique used to measure coherence in the HeartTuner to brain voltages also. Additionally, the lock in phase relationship between heart and brain in displayed, very close to " real time"
Below are some Brain/ Heart screen displays and comments, thanks to Marysol in Spain,
for more info see
(Below Brainwaves in Yellow, Heart Voltage in Blue)

Below an example from the older HeartLink - comparing Heart and Brain.
"It has been a new and exciting adventure to develop the HeartTuner. Many new dimensions of understanding will be opened to us as we dwell deeper into coherence and all its possibilities."
1.- Sustained coherence of the Golden
Mean. It must have been only for my eyes, due to my great synchronistic
luck and to let me know that it can be done; to reach a clear
connection between the heart and the mind, when the first time
I (measured) for more than one hour a connected coherence in 0.6
of both the heart and the mind. It was a special moment when I
was involved in a deep and important conversation inside my mind
with a loved one. Yes the heart was at the LOVE/WONDER COHERENCE,
and the brain too, perfectly embedded and the rate was almost
the same in the brain, which normally shows much larger numbers
it showed 88, 87 bpm too, of course the brain changes much more
often, but it was amazing how sustained it was both coherences.
Of course I never saw this again, not only is it difficult to
attain brain coherence, but if one gets it, it does not last for
very long, not even a second most of the time. IT CLEARLY DEMONSTRATES
that when we obtain coherence in PHI GOLDEN MEAN IT IS RECURSIVE
AND CAN LAST LONGER. I am sorry I could not take a print screen
of this amazing moment.
Welcome to this help page. In here you can learn how to work with the program.
The idea of the program is that it is possible to steer the waves that make your heart tick with intention. Feeling love and openness makes different waves than being intellectually or conceptually occupied. These waves can be measured with the HeartTuner and this data is used for our game. Actually, only the Emotional Index (1/Hz) and the amplitude are measured. The Emotional Index (E.I.) is a proven measure for your emotional state and the amplitude is a measure for the coherence of your waves.
In the game the EI is displayed by the position of the arm, where the amplitude is related to the length of the arm. The data is display at a regular time interval. By playing together you can see how you relate to each other at that moment. The game has several objectives.
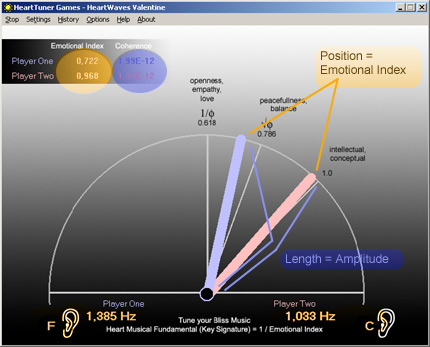
The program file has to be in a directory in the directory
where the HeartTuner program is located. E.g. If the HeartTuner
program is in C:\Program Files\HeartTuner then the game
program should be in C:\Program Files\HeartTuner\Valentine.
The Eidata.txt file is supposed to be in the same directory
as the HeartTuner program.
The game uses two directories with resources:
You can create a shortcut to the game by right-click on the file icon, Copy to/Desktop as shortcut.
NOTE: First start the HeartTuner software.
Click on the menu to start a function.
| Menu | |
| Start/Stop | Start the game. |
| Settings | Mathematical adjustments |
| History | Show the past data |
| Options | Settings of how the program works |
| Help | Show this help file |
ÝÝÝÝÝÝÝÝÝÝÝ
The settings control how the data is transformed in to a position of the arm. All settings will only get active after pressing the Ok button. Use Cancel to return without making changes.
This option first takes the logarithm of the input data, before further processing.
Takes an average of the data by taking the previous values into account. The factor determines the weight of the previous data. Can be set for both the amplitude and the index.
If you are playing the game alone, deselect the channel you are not using. That channel will not be displayed as an arm or sound.

Absolute input values are multiplied by the set factor. The factor consists of two parts:
The old value is the current Amplitude for that channel. The new channel is an indication of what the new value will be when transformed by the set factor.
NOTE: To display correctly the scaling should project on an interval between 0 and 1.

Using this feature will allow for a dynamic gain adjustment taking into account the history of data.
Use limited time history
This option sets a queue that takes only a limited amount of data up to 100 points. This data is then used for relative scaling.
Use global minimum/maximum
The new data is compared to a historical minimum and maximum and returned as a ratio of their difference. The current values are displayed.
TIP: You can use the Reset button to delete previous minimum and maximum. This is useful if you had some exceptional data due to interferences.
Shows the Emotional index and Amplitude for both players.
The option dialog sets various settings about how the program works. All settings will only get active after pressing the Ok button. Use Cancel to return without making changes.
Sets the filename for the input data file. Usually this is ìEidata.txtî and is located in the same directory as the HeartTuner software, one directory below the location of the game program.
Use Select to connect to the filename when lost or changed.
Sets the amount of time between data captures in milliseconds. Currently the HeartTuner writes new data to the file once every few seconds. This update time should be at least half of the time the HeartTuner takes in order to get realistic data timing.
The settings involve the sound.
Sounds a beep every time new data is displayed.
Translate the Emotional Index value into a harmonic series of sine waves.
Sounds the relative key related to the Emotional Index and Amplitude determining the volume.
The Emotional Index value will be translated into a series
of three sine waves whose frequencies relate to the harmonics
in your heart. The seperate values for each sine wave can be set
accordingly for volume and balance (left/right).
If you have a slower CPU (<500 Mhz) you can choose to make
smaller samples.
These settings influence the way the sound is played.
Shows if a MIDI device is running.
Useful to examine if a device will play. Gives a sound when running.
Sets the overall volume for the played notes.
Sets the instrument patch used for that player.
Sets where the sound is located in the stereo field for that player.
Sets the channel on which to play a note for that player.
Use to set a specific MIDI device for playing a note.

Enter the name of each player here. They will be displayed in the game instead of the default Player One and Player Two. An empty box will reset to default. Type in a space only to get no name displayed.
Sets the colours of the arm and text on the screen for each player. Press Select to change colour.
NOTE: Use contrasting colours to the selected background.
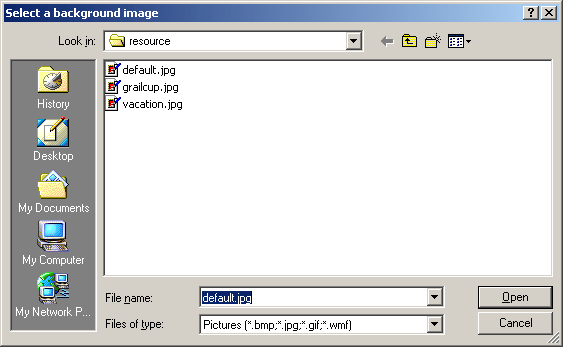
Sets the background theme image. By default loads ìdefault.jpgî. Also available are ìgrailcup.jpgî and ìvacation.jpgî. A small preview is shown.
To end the game session, press the X button on the top right of the game window. A dialog will appear to save the settings made in the current session.
This will store the current setting. The next time the program is run, names, colours, images etc. will be restored.
Does not store the settings made in this session. This will have the program start up with the previously stored settings.
This option will clear all previous settings and have them set to defaults.